Immersive Research Lab @UW X Teague
Timeline
6 Months (June - Dec. 2022)
Platform
Web + VR
Collaborators
2 UI/UX Designers, 1 User Researcher, 1 PM
My role
Led design and research for a VR-enabled platform that streamlines qualitative studies, enhances emotional insights, and reduces fieldwork costs through iterative user-centered design and cross-team collaboration.
THE PROBLEM
How might we use emerging technologies to support user evaluation
in complex environments?
Teague researchers face multiple challenges when conducting qualitative research on public infrastructure. Therefore, research cycles become lengthy and expensive.
High Cost of Field Research
Teague researchers conducting qualitative studies, particularly in public infrastructures like airports, face significant time and financial burdens. This involves frequent site visits and participant recruitment for live interviews, making the process costly and time-consuming.
Need for Richer Data
There is a critical requirement for more nuanced data capturing emotional and situational responses. Current methods of gathering qualitative insights, which include observing verbal cues,body language, and facial expressions, are intricate and susceptible to biases, often resulting in less accurate data.
Fragmented Research Tools
The qualitative research process is hindered by a disjointed array of tools such as survey, note-taking, and scheduling software. This fragmentation leads to inefficient, prolonged, and costly research cycles.
Our approach
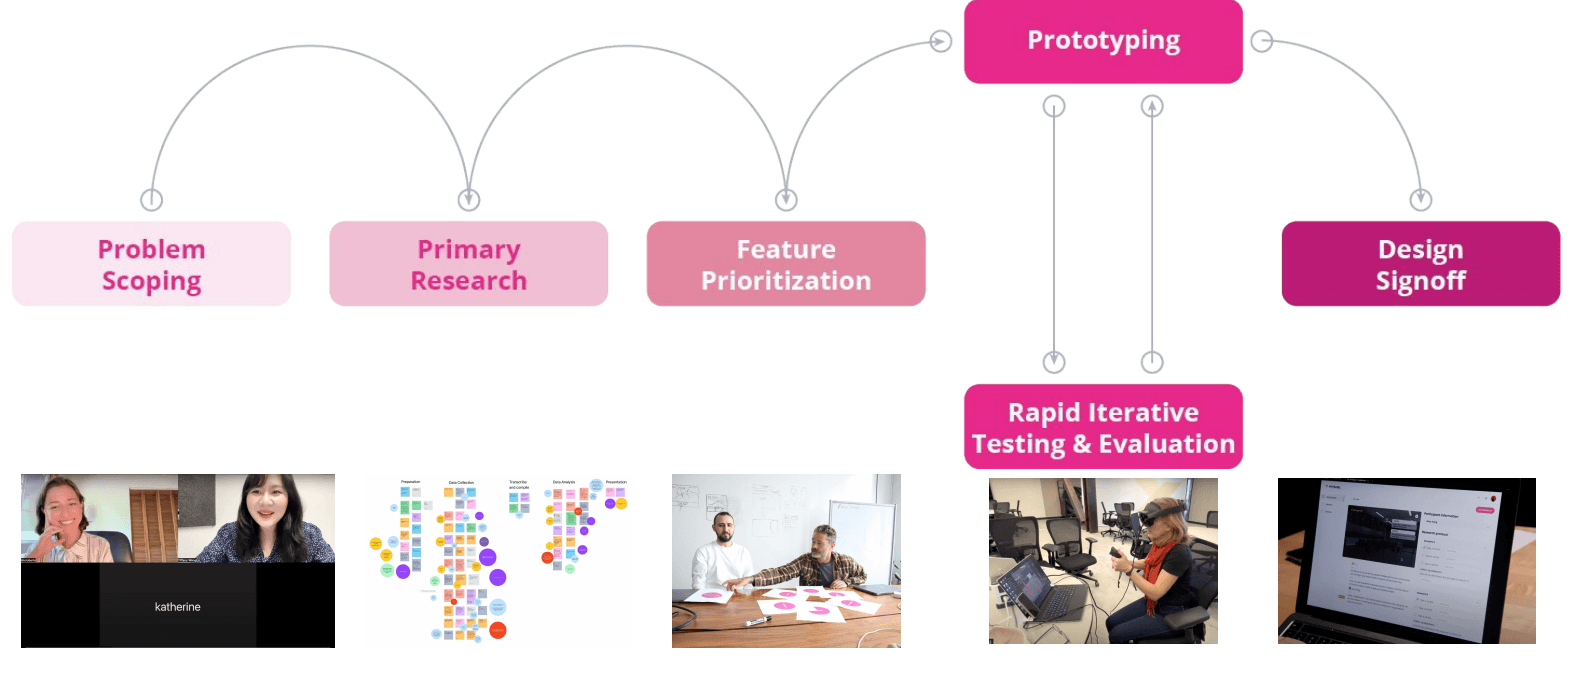
Since this is a unique problem space, we spent our early stages problem scoping. We learned that design research is done differently at design consultant companies when compared to big tech, so when choosing interview participants, we scoped down to interviewing and doing cognitive walkthrough that user group to learn more about their workflow. Then we went into defining feature prioritization and started prototyping after doing 2 months in discovery phase.
We then went into designing and development stage and used the Rapid iterative testing and evaluation method to make sure we are getting the right design.
Meet Immersive Research Lab
To showcase our product’s use case, we created an airport wayfinding VR experience to test it out. Imagine this is a simulation that explores how different sign placements and space layouts would affect the traveler’s airport experience.
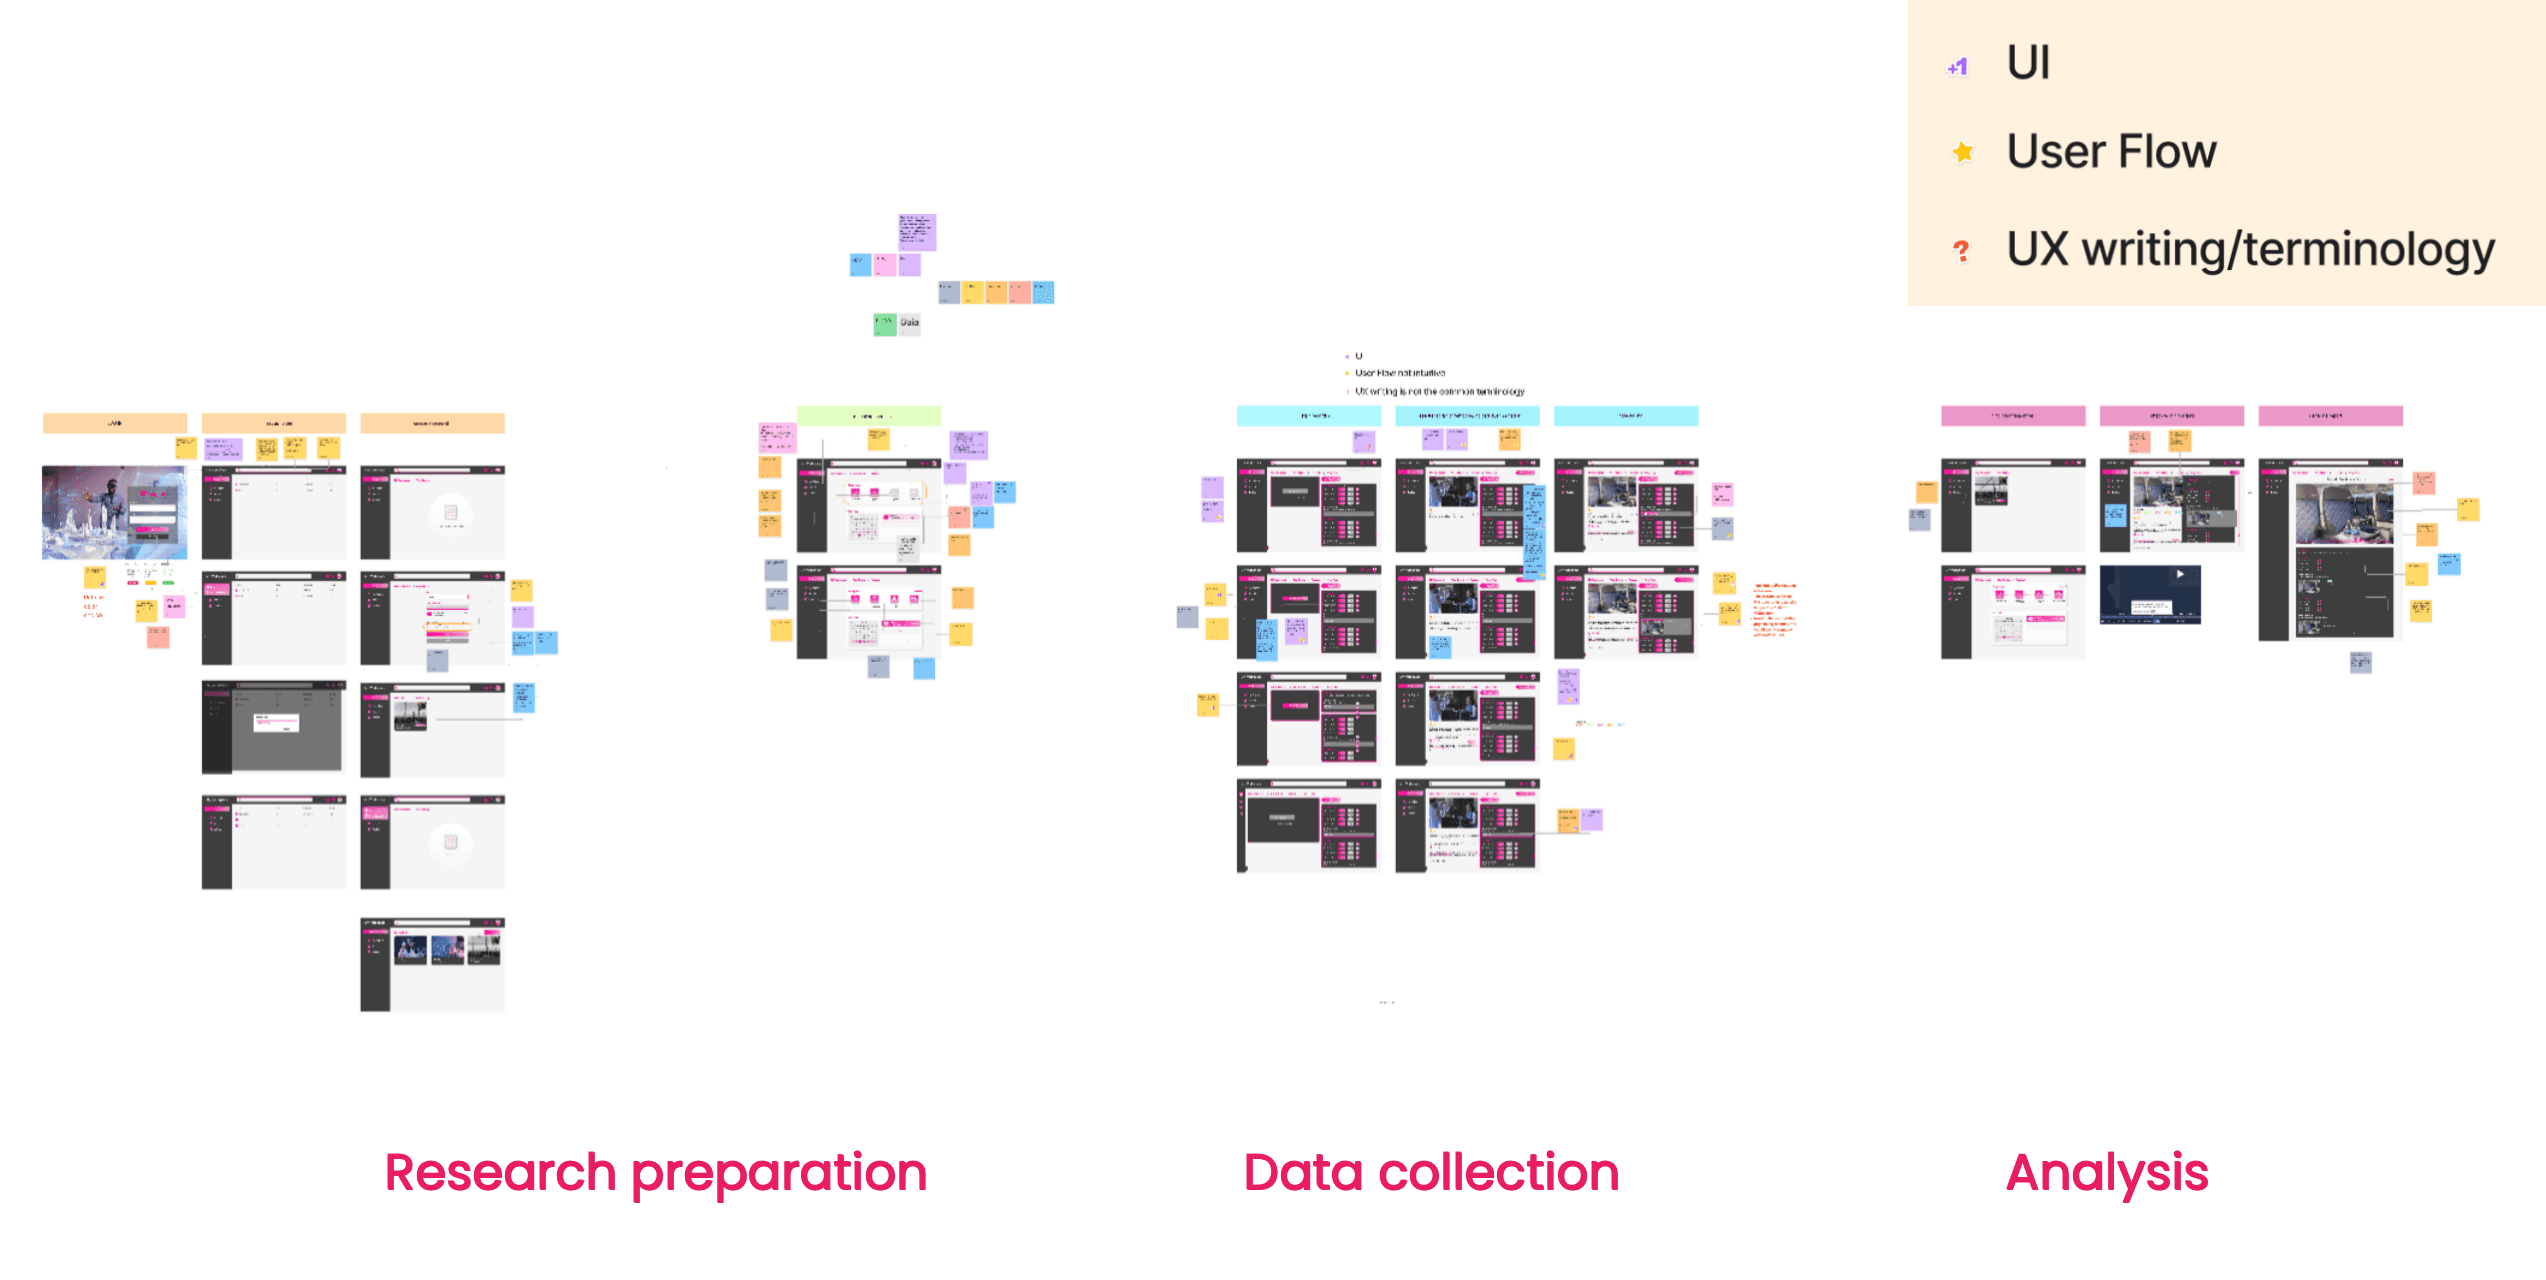
Research Preparation
Through its step-by-step information archiving and modular templates, Phygital empowers researchers to easily prepare research protocols, recruit participants, and schedule activities prior to collecting data.


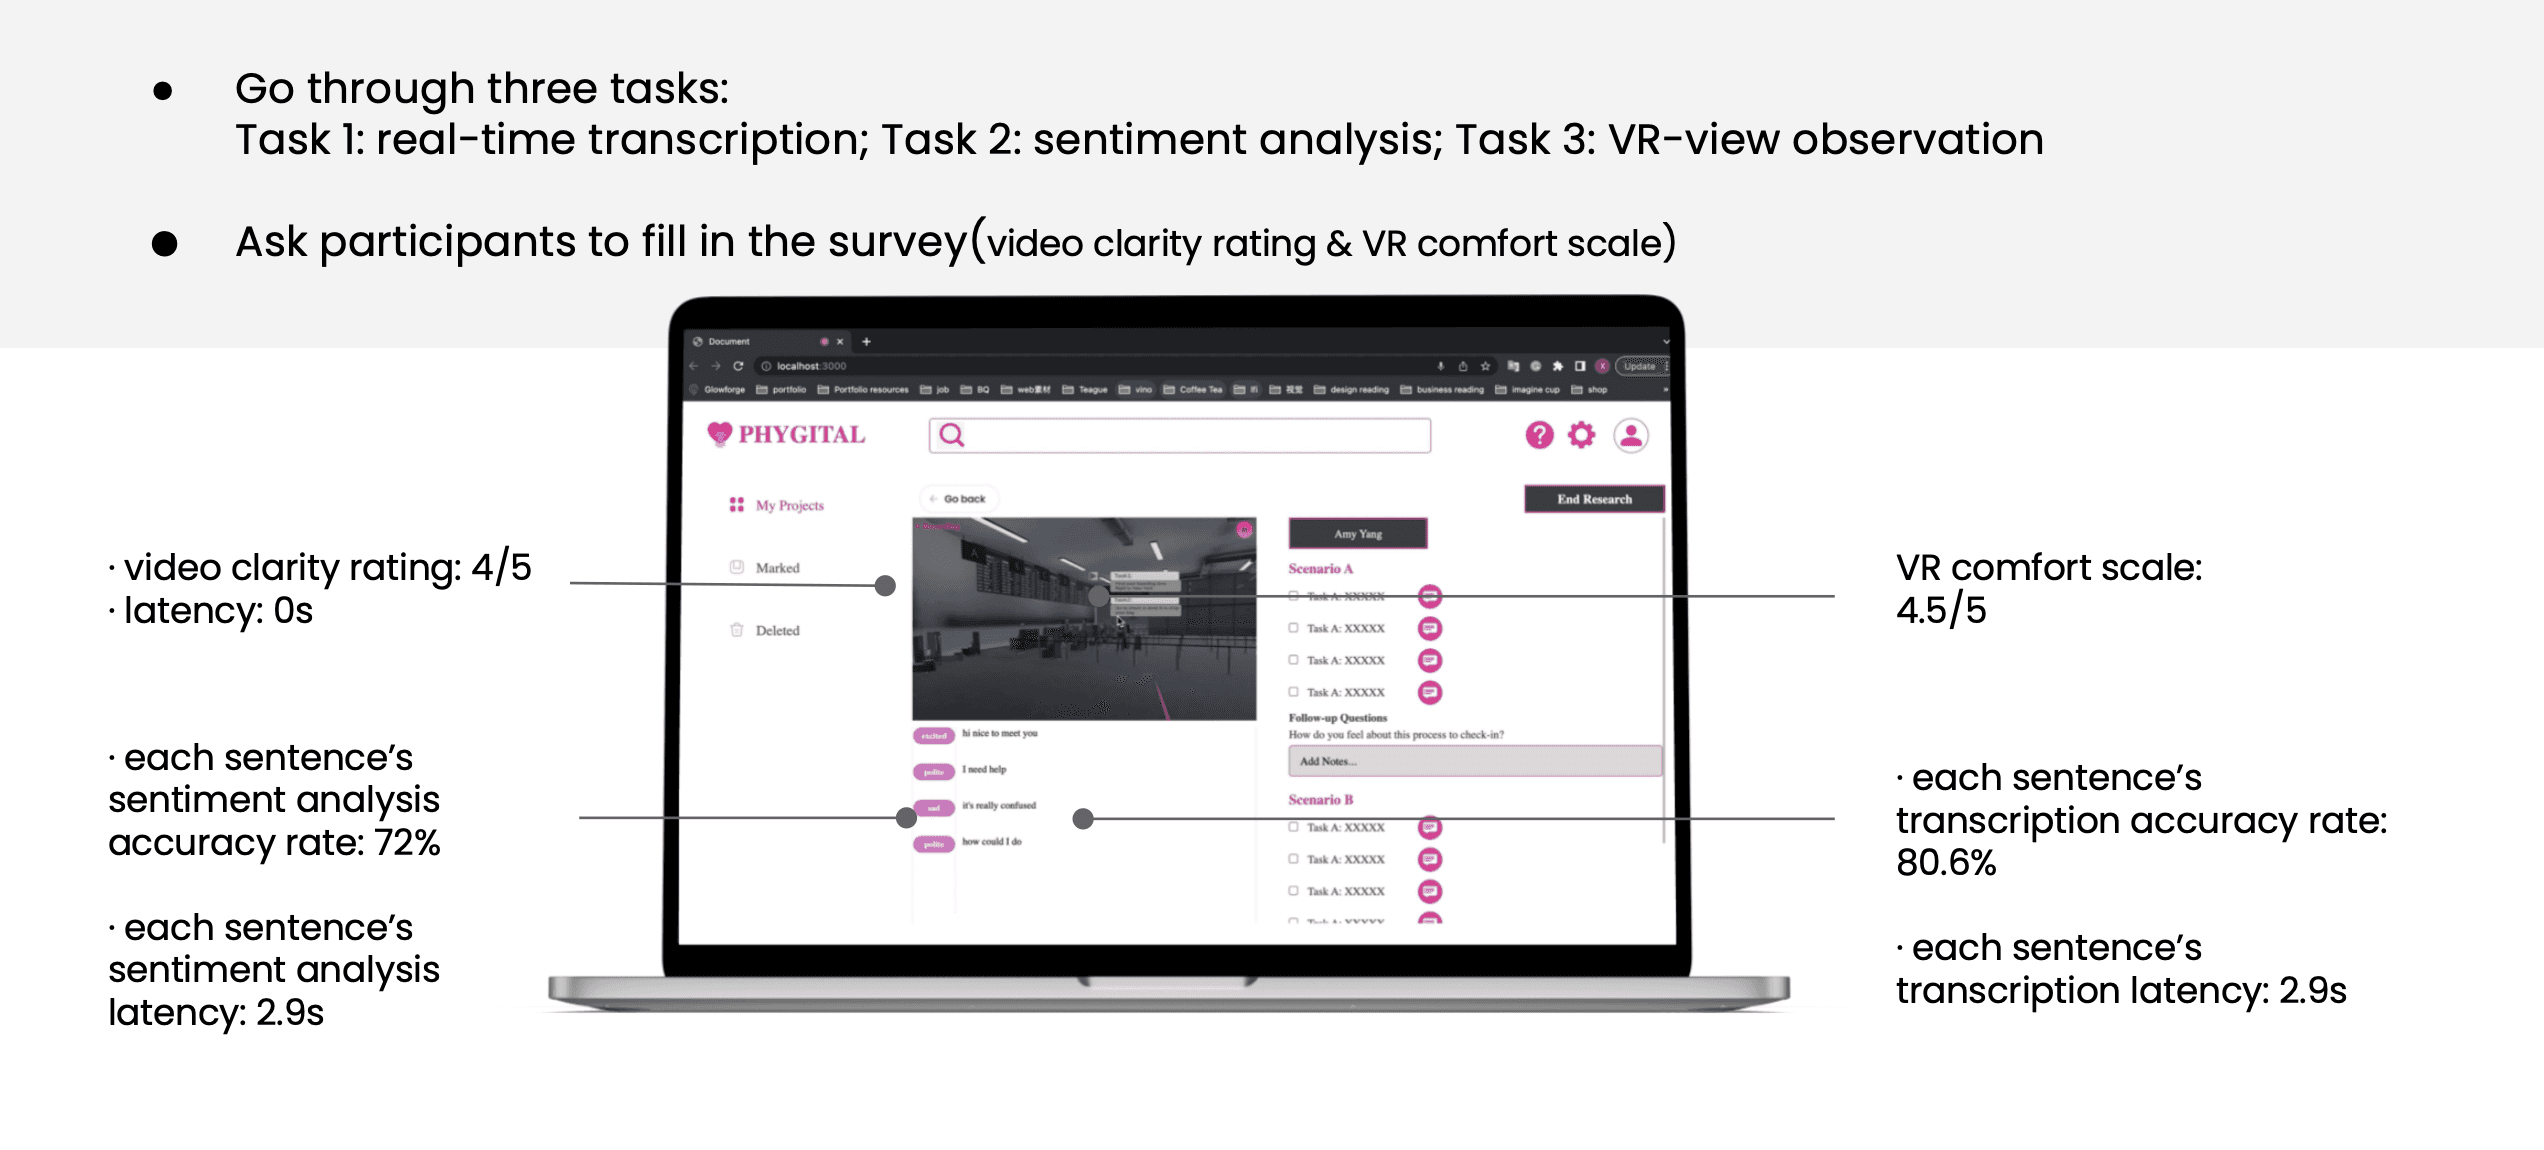
Data Collection
Researchers can collect real-time data on participants’ transcription and emotions and capture immersive data through VR views, providing a more complete understanding of participants' experiences.
Research Methodology & Insights
Deep Dive into User Needs
To anchor our design in real-world needs, we conducted a mixed-methods research approach, blending qualitative and quantitative insights.
Understanding Researcher Pain Points
Cognitive Walkthrough: The workflow of our web app is new to the design researchers, we use this method to evaluate learnability for new user.
Participant Observation: We want to see how participants behave in a natural setting,bwhich helps us to see and understand what people are doing, which we can compare to what people are saying.
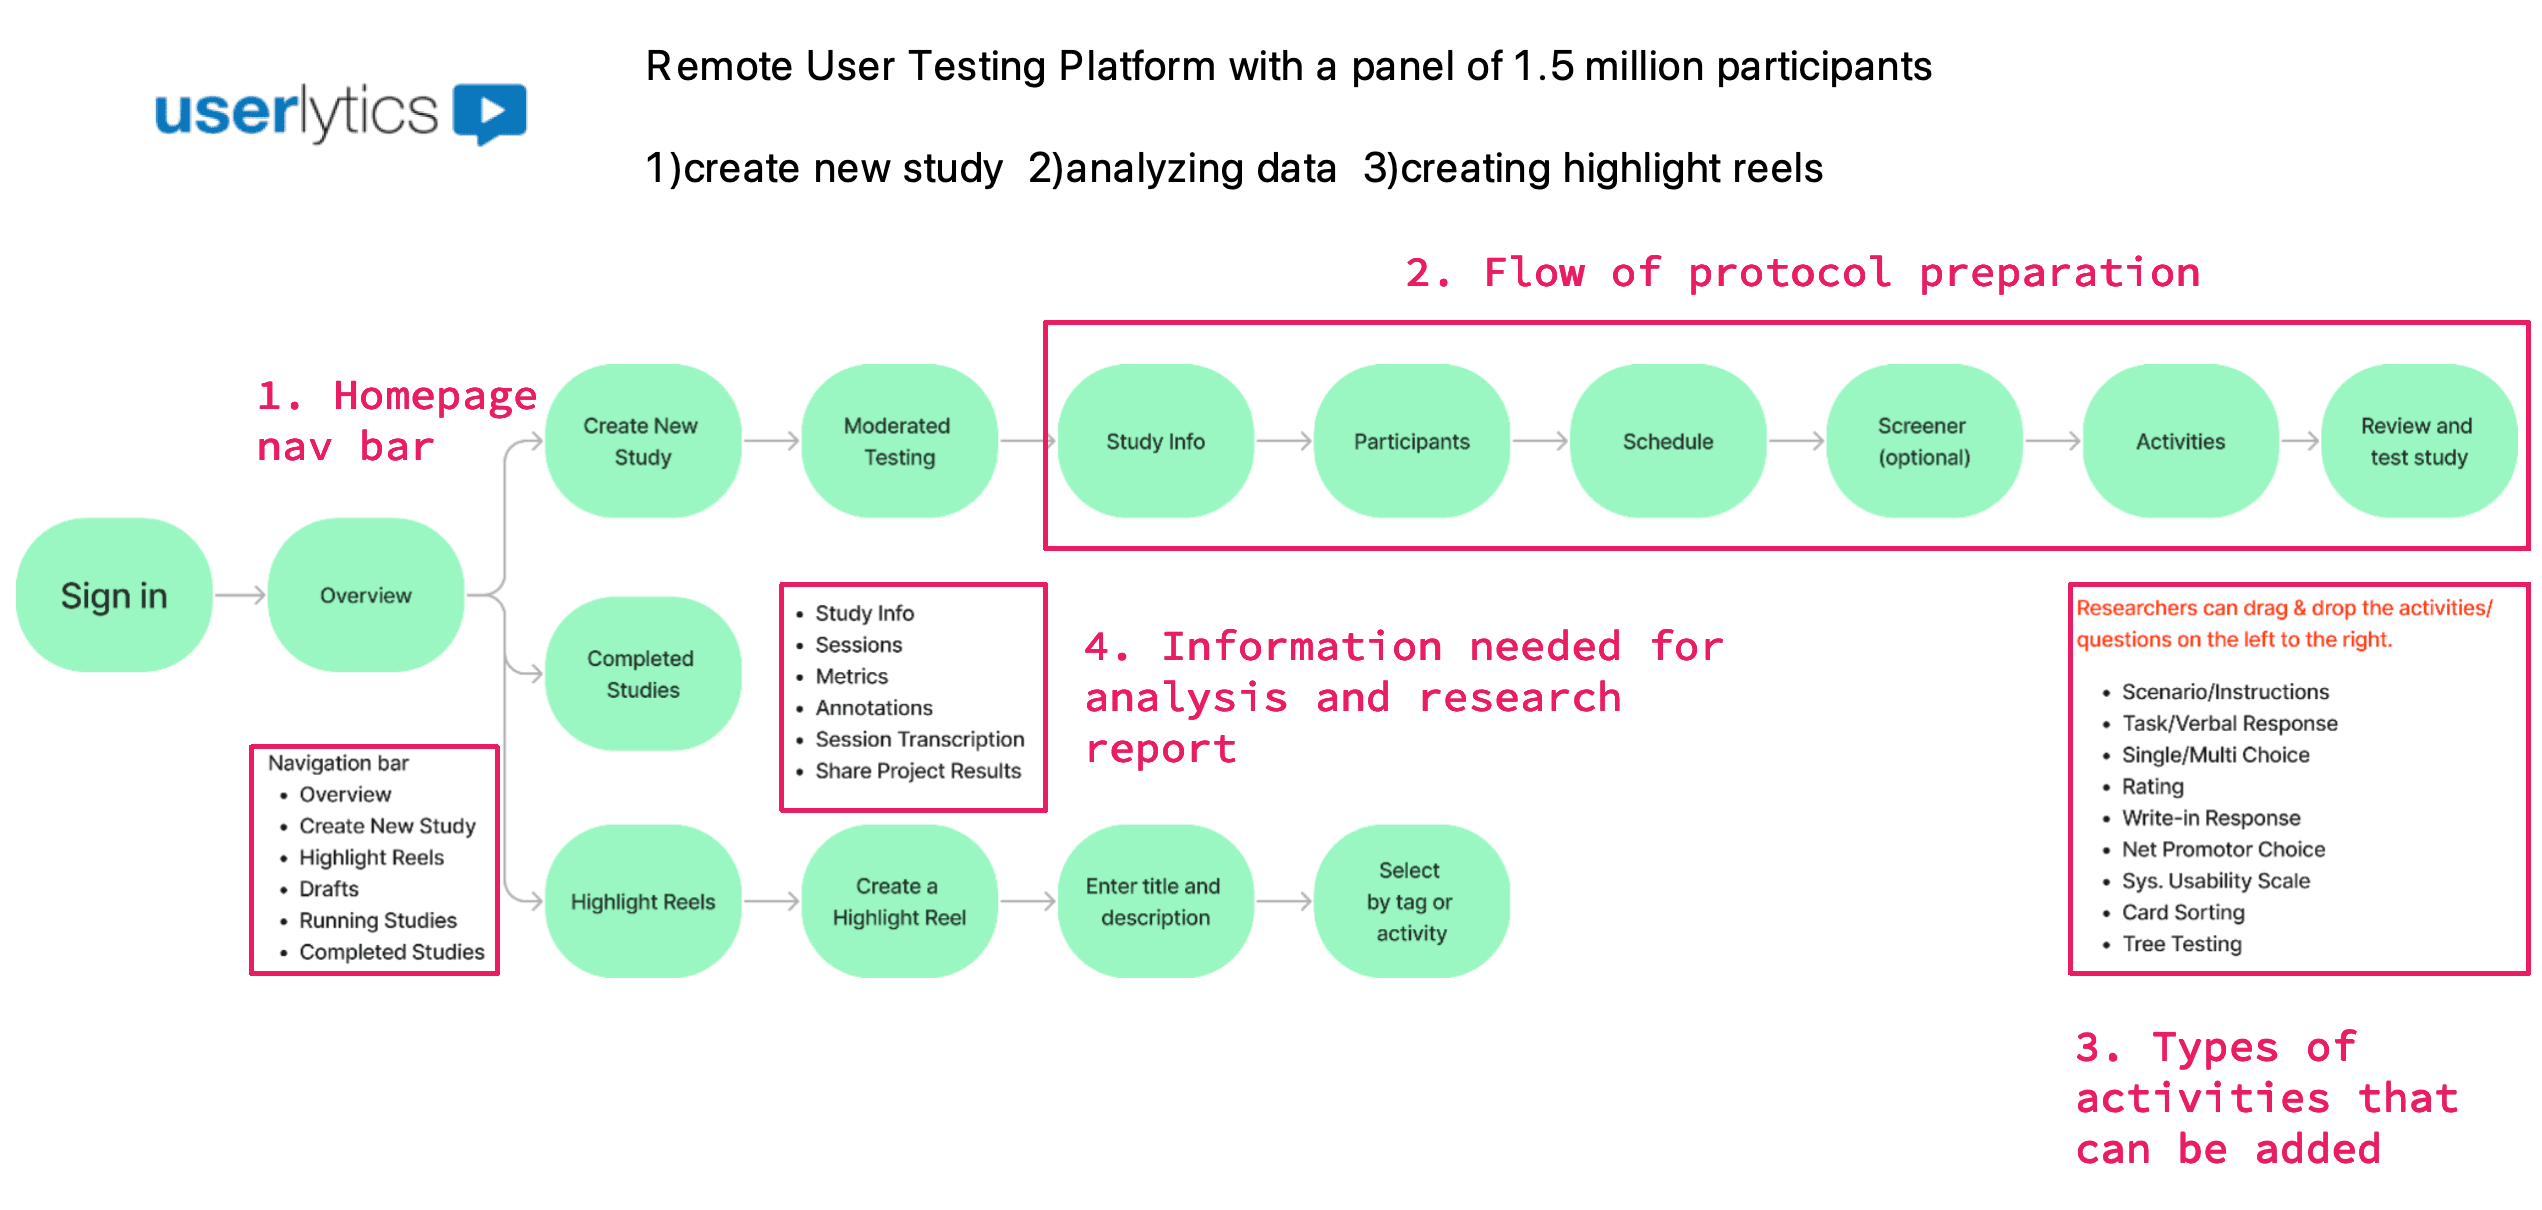
Heuristic Evaluation of Competitive Products (Information Architecture & UI): Benchmarked tools like Userlytics and Notably to identify gaps in modularity and automation.

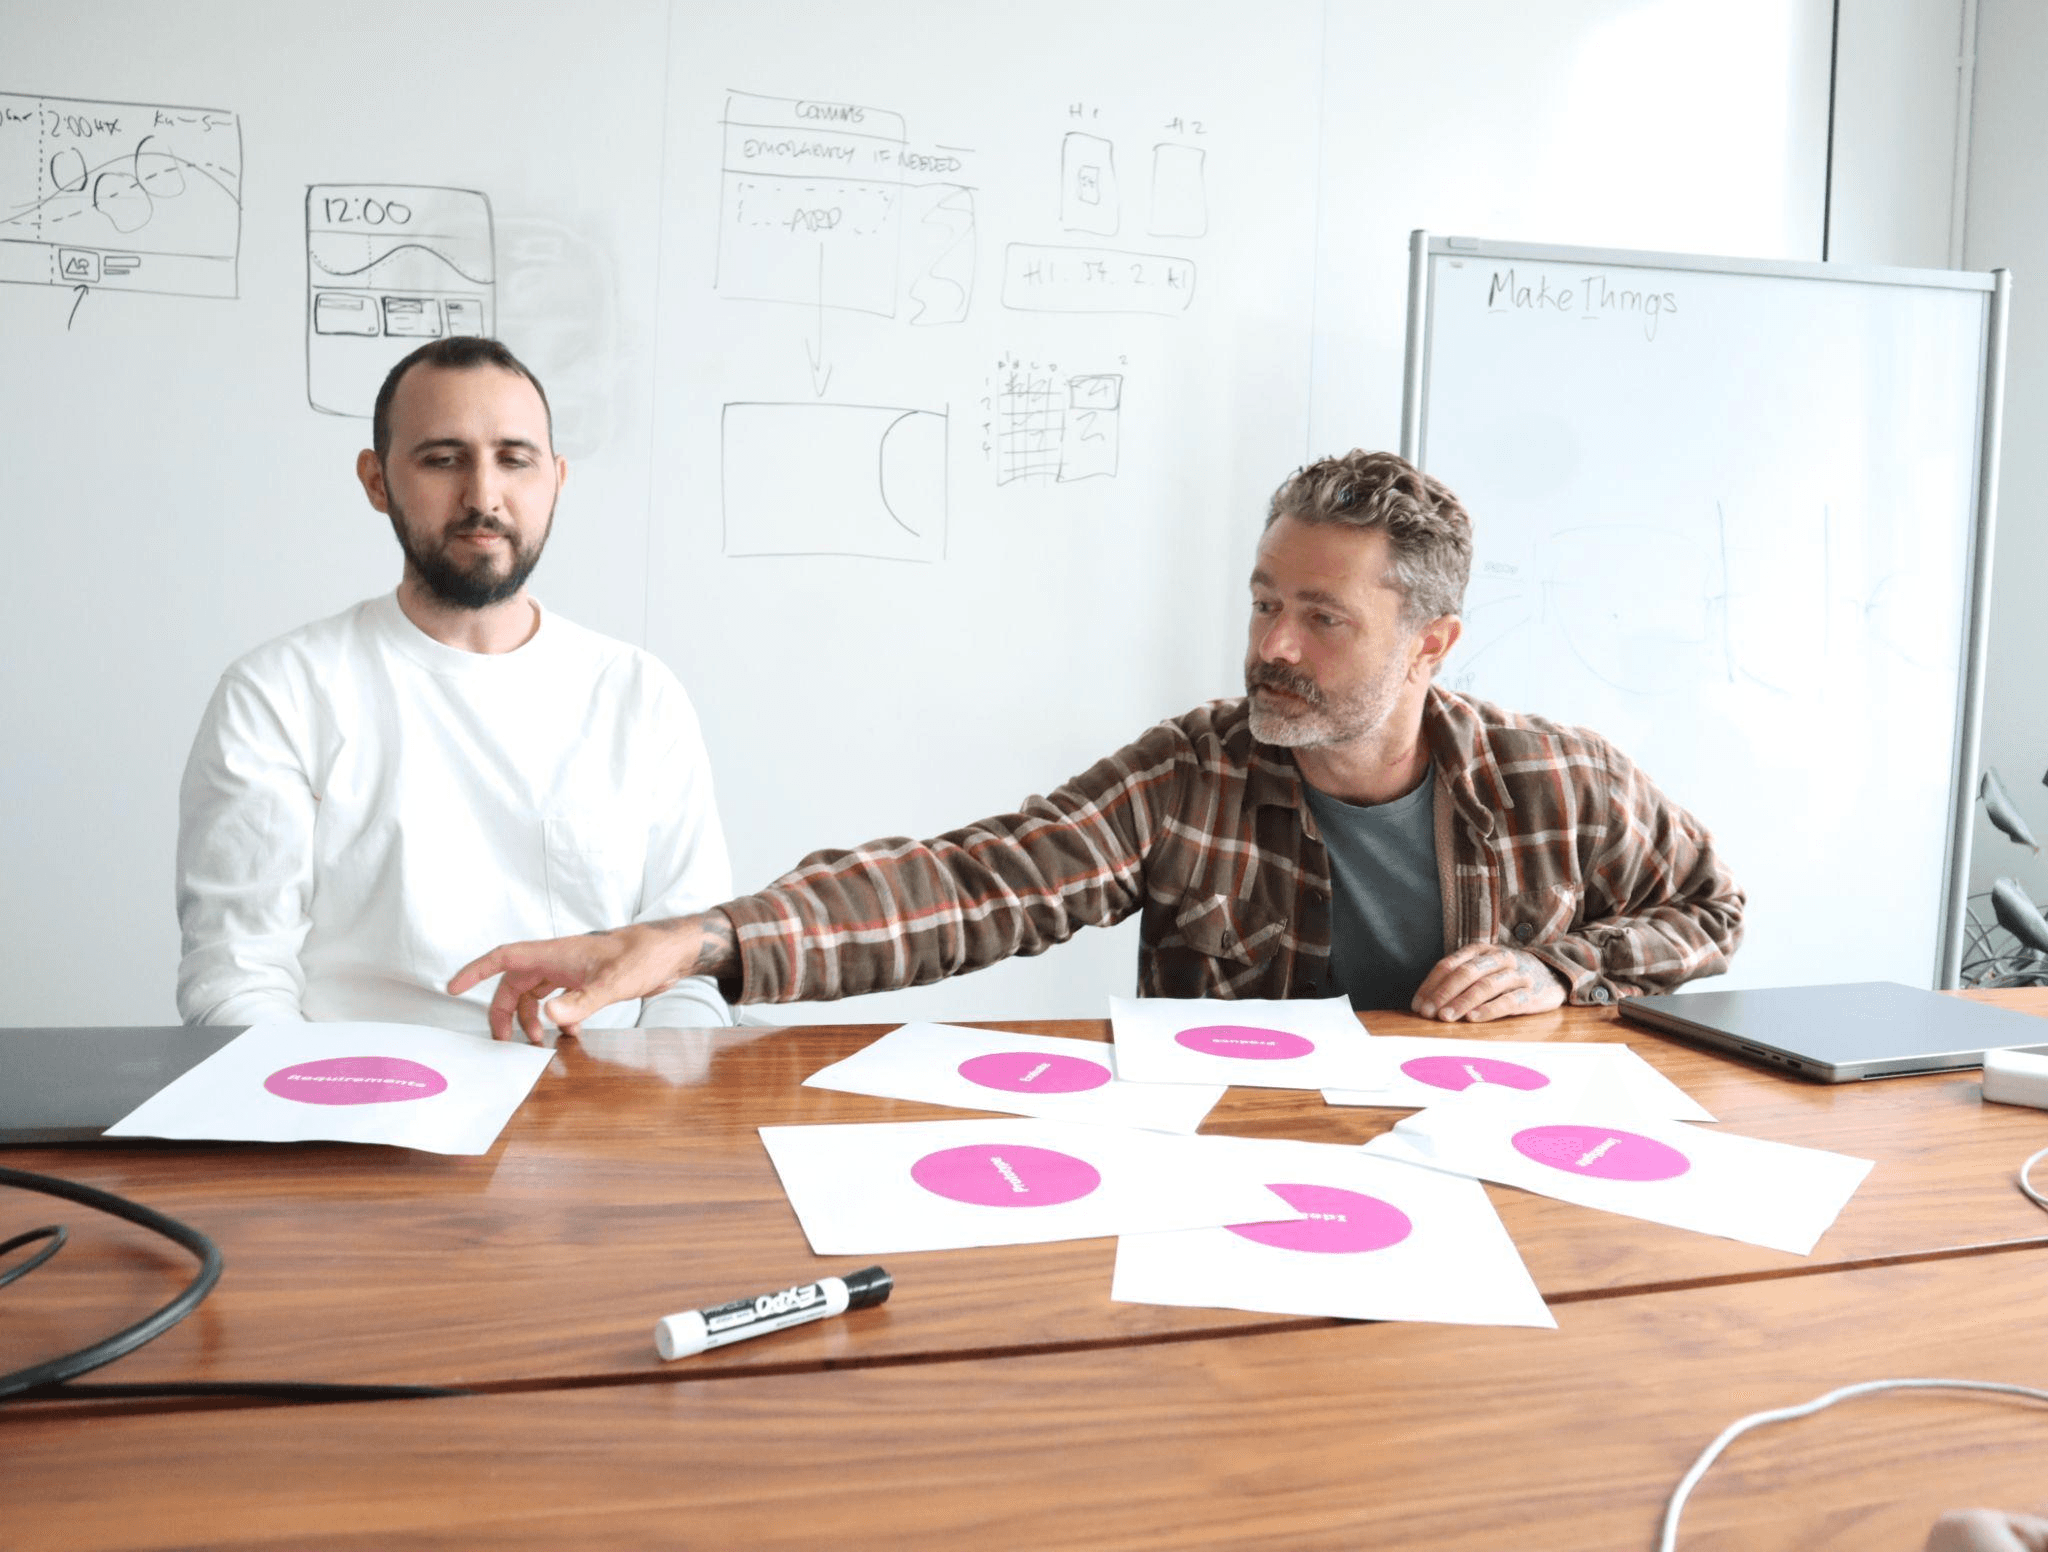
Card Sorting: Collaborated with researchers to prioritize critical data types (e.g., emotional cues, spatial behavior).
Prototyping & Validation
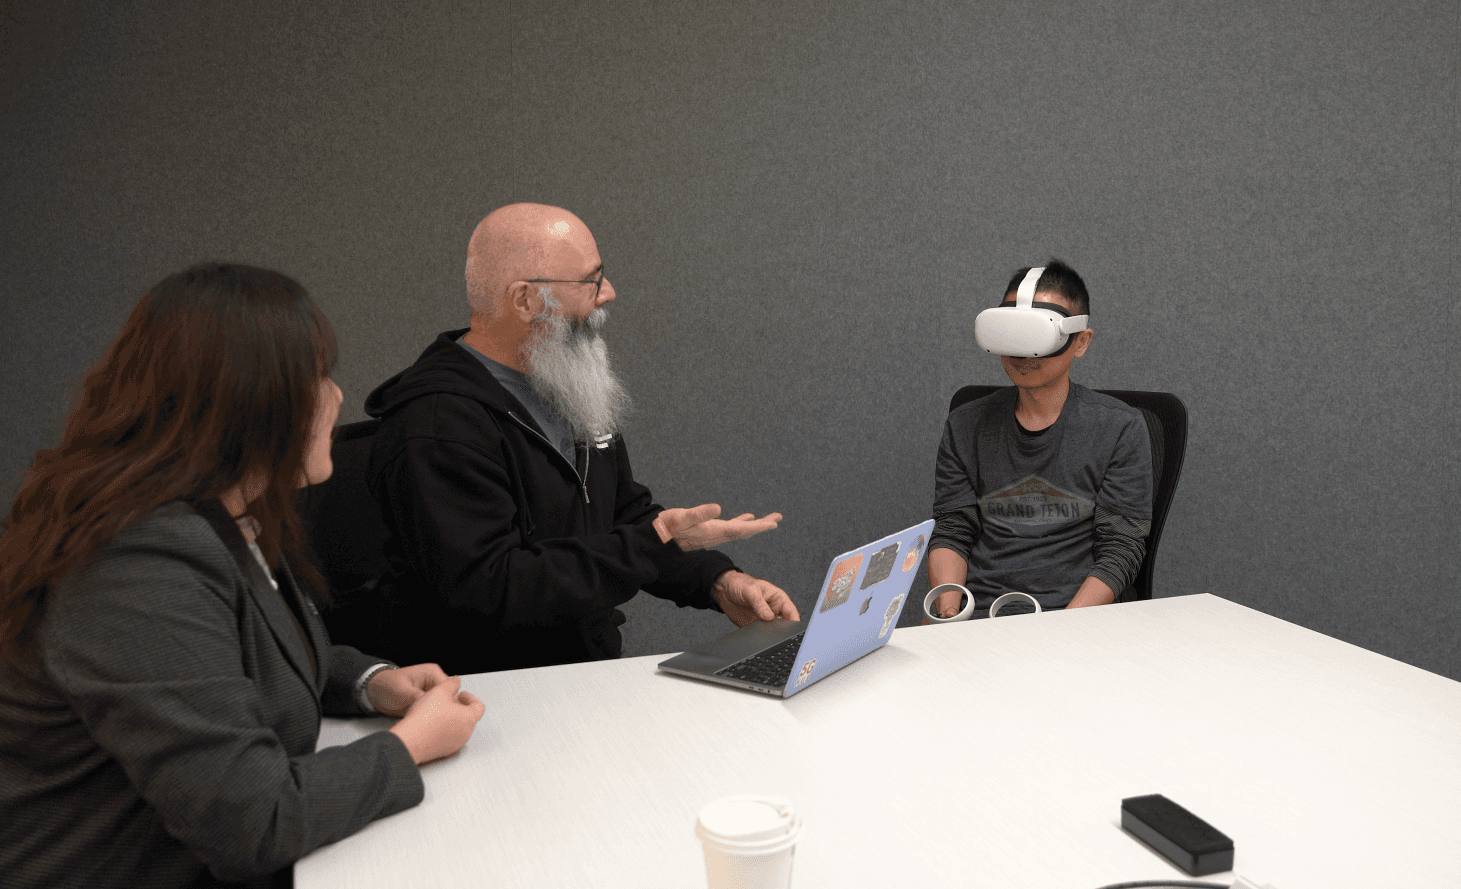
VR Simulation: Built a virtual airport environment to test wayfinding designs, enabling controlled observation of participant behavior.

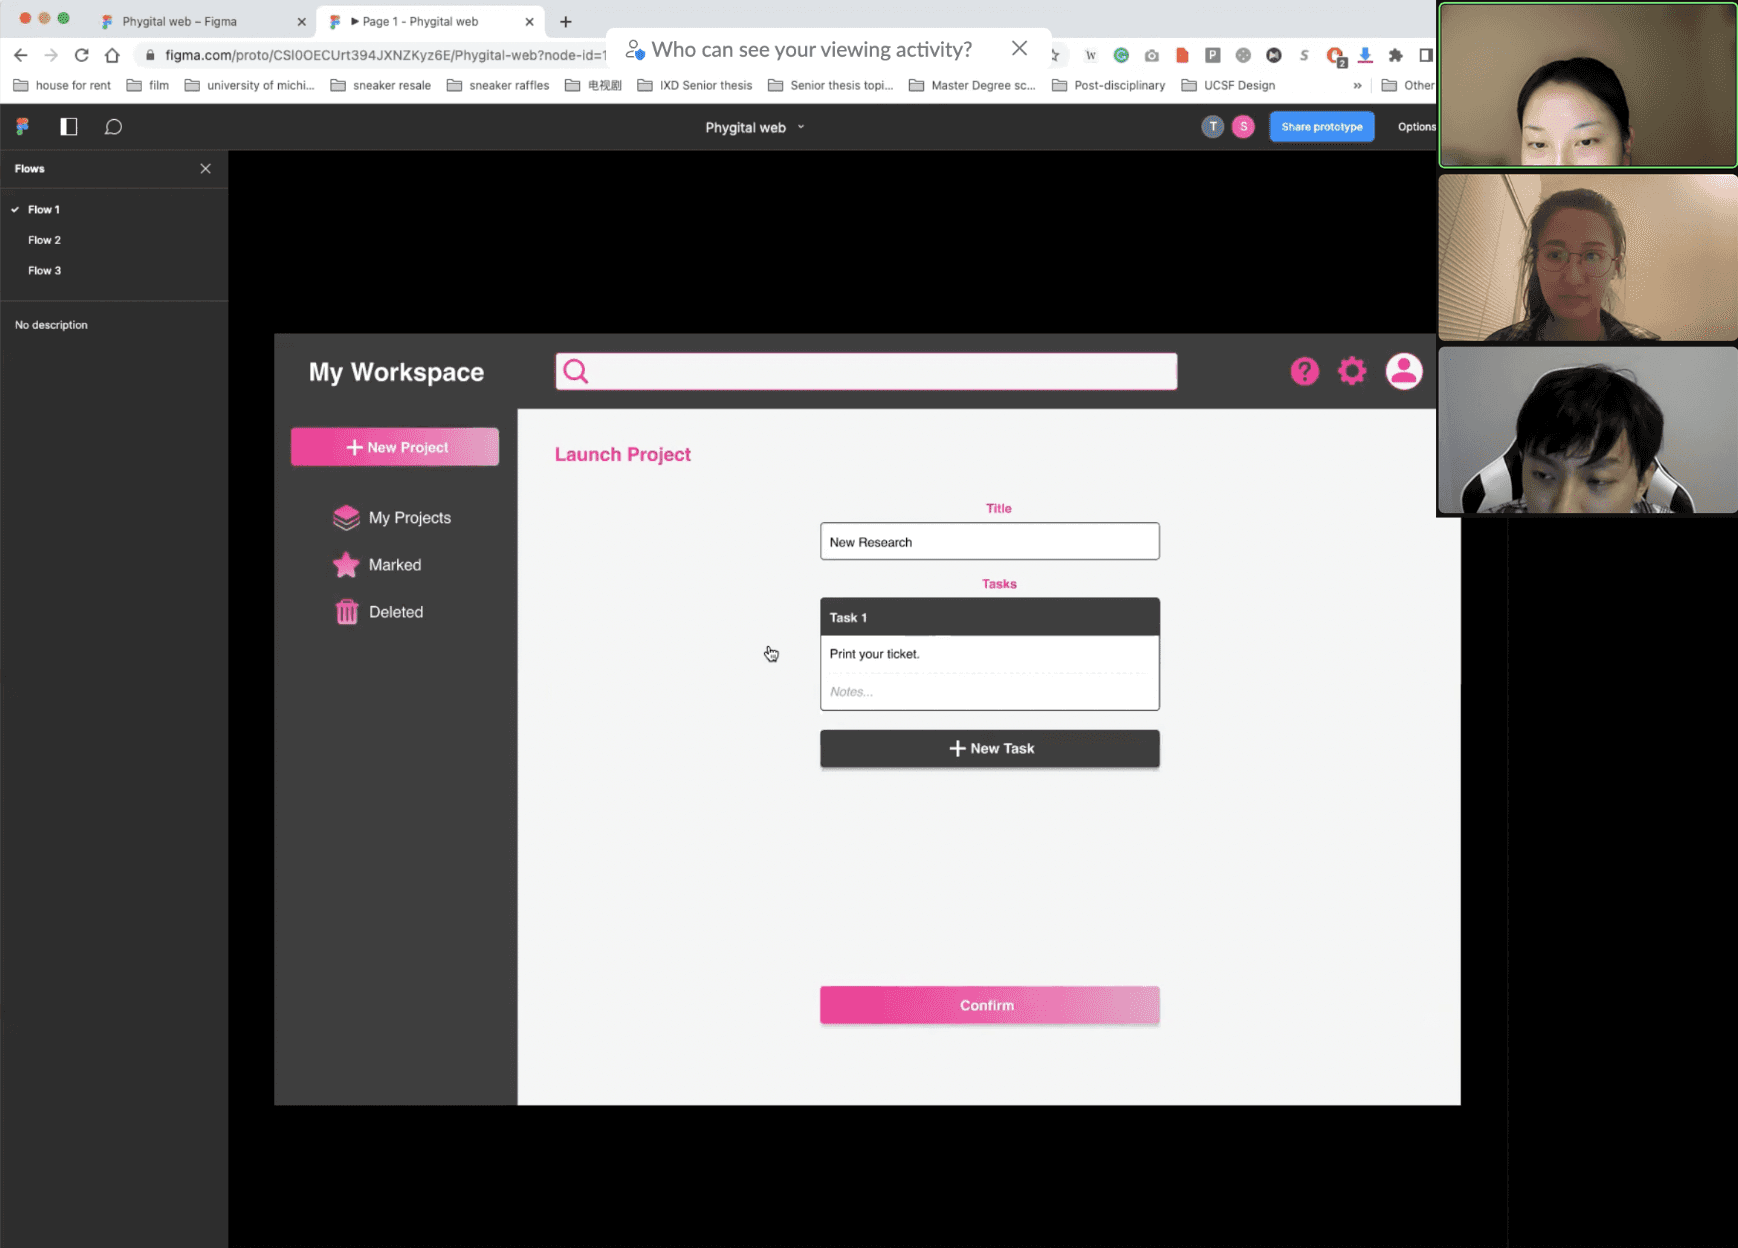
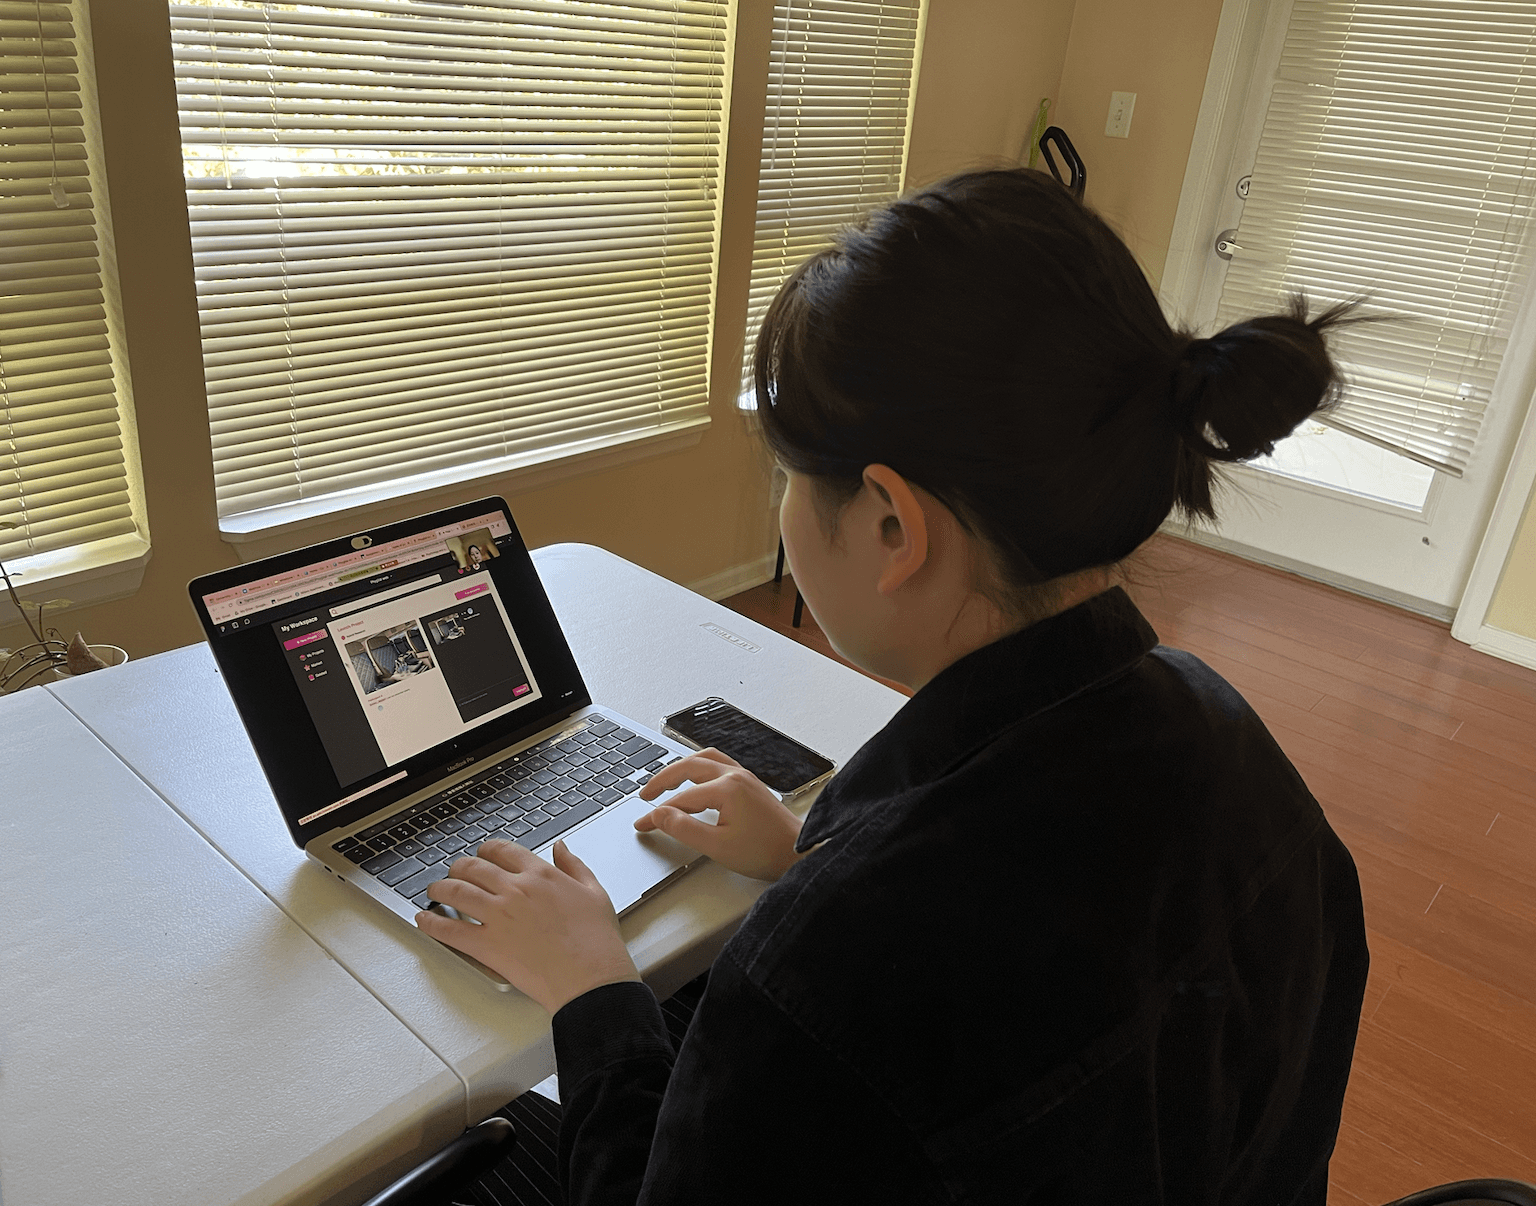
Iterative Testing:
We conducted 11 qualitative user evaluation sessions (7 in-person, 4 remote via Zoom)
Throughout the whole week we iterated 3 times (mainly on the text and some UI)
Synthesis & Behavioral Mapping
Triangulation: Combined VR-recorded sessions, SER data, and researcher annotations to validate insights.
Automated Reporting: Generated post-session reports with clips, transcripts, and emotion graphs, cutting synthesis time by 40%.

Design Challenges & Solutions
Streamline qualitative research by unifying tools, automating tasks, and capturing richer emotional/spatial data.
Challenge 1: Fragmented Tools → Inefficient Workflows
Problem:
Disjointed tools caused data silos and wasted time reconciling insights.
Solution:
All-in-One Platform: Unified protocol creation, scheduling, and data collection into a single interface.
Modular Templates: Drag-and-drop protocol builders reduced repetitive tasks (e.g., screener creation) by 60%.
Validation:
Card sorting prioritized template flexibility; competitive analysis informed automation vs. customization balance.
Challenge 2: Superficial Emotional Insights
Problem:
Traditional methods missed real-time emotional reactions.
Solution:
VR-Integrated Sentiment Analysis: SER flagged frustration during VR simulations (e.g., airport wayfinding).
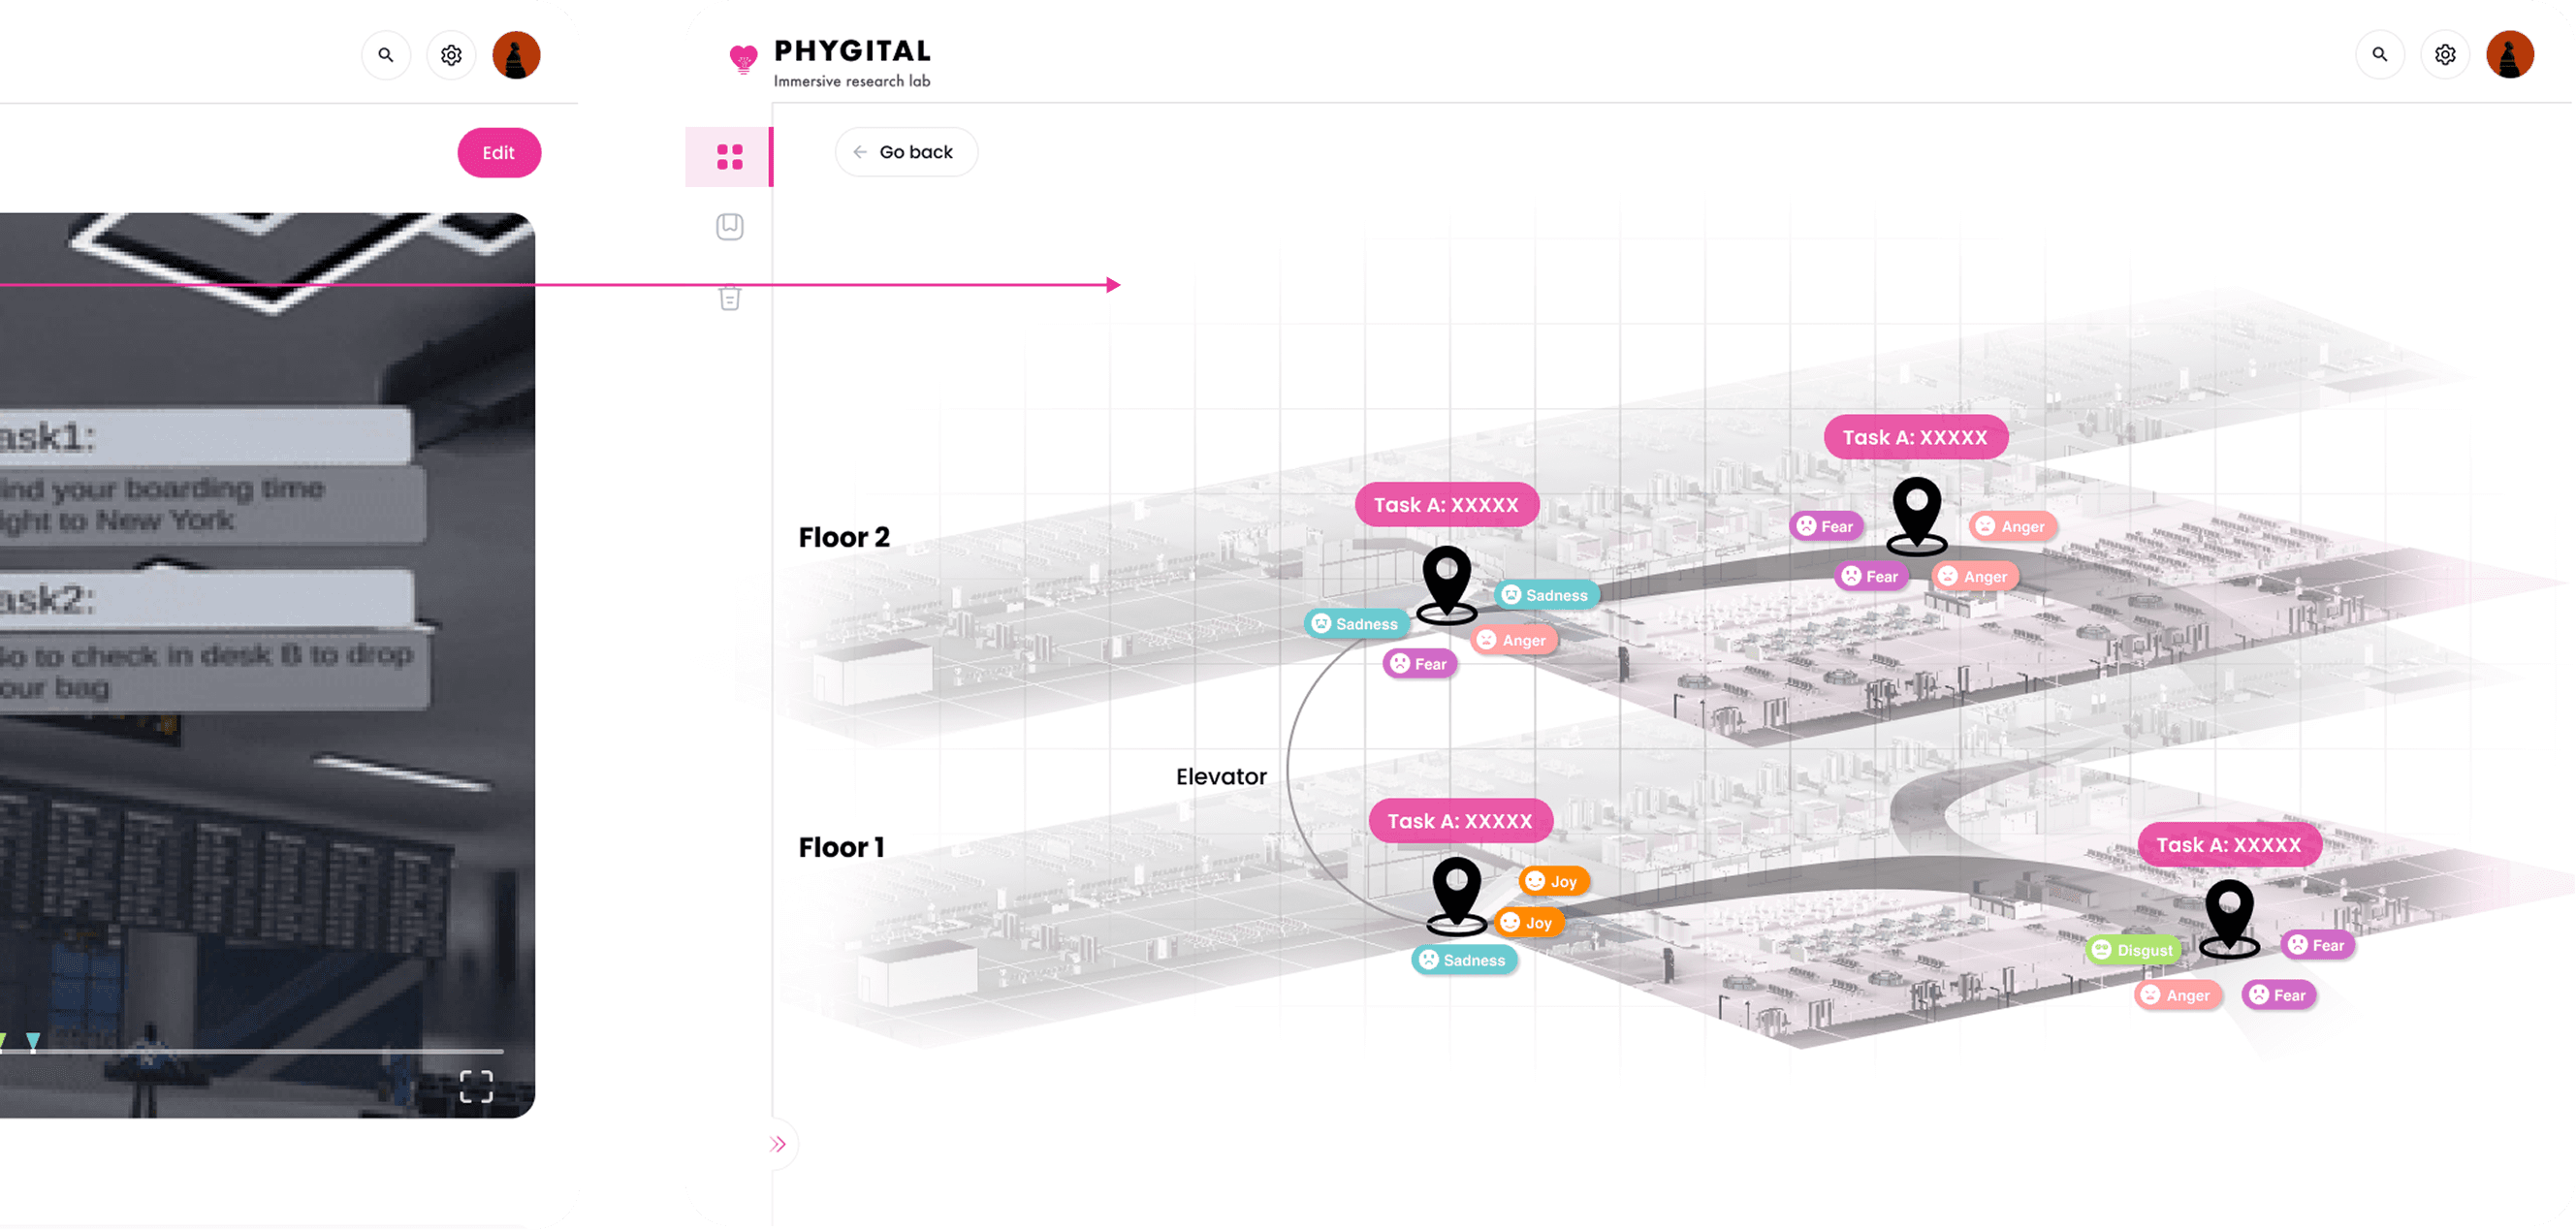
3D Heatmaps: Visualized dwell times and gaze patterns, linking spatial design to emotional spikes.
Validation:
SER improved insight accuracy by 35% vs. manual note-taking, validated through effort/user-value matrices.
Challenge 3: Prototyping Delays in Physical Spaces
Problem:
Field iterations for infrastructure changes were costly and slow.
Solution:
VR Simulations: Created ecologically valid airport environments to test signage placement.
Real-Time Observation: Web-based VR viewports reduced site visits by 50%.
Validation:
Behavioral mapping in VR uncovered pain points (e.g., poor lighting at security checkpoints).
THE SOLUTION
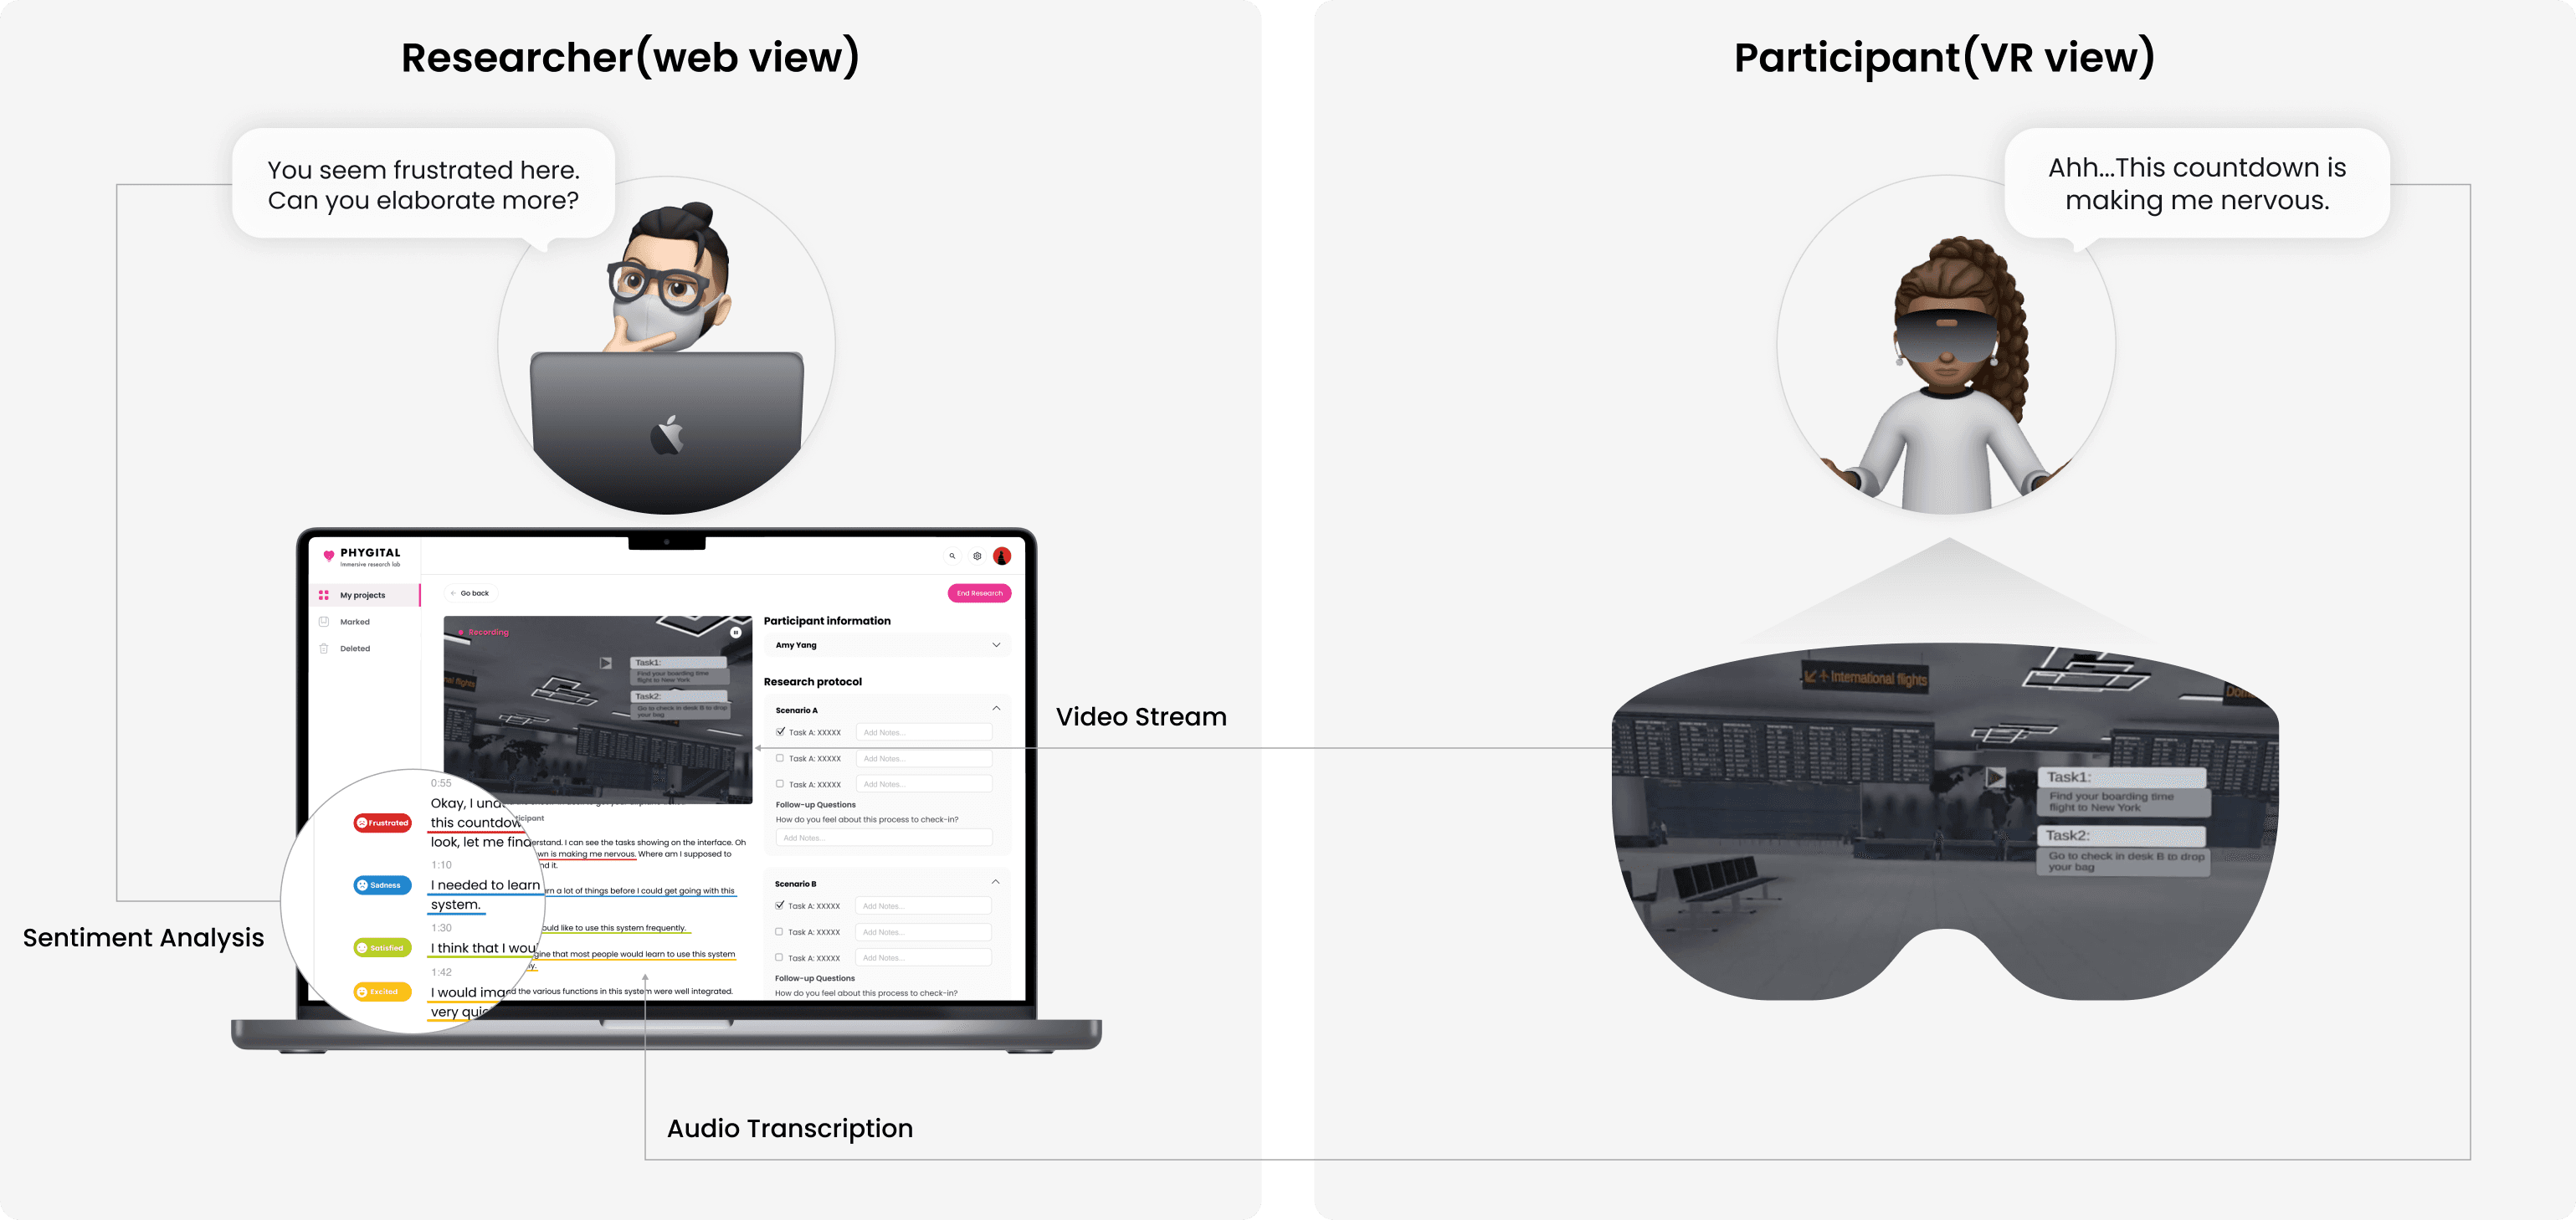
An all-in-one research platform that provides researchers real-time insights with user’s VR perspective.
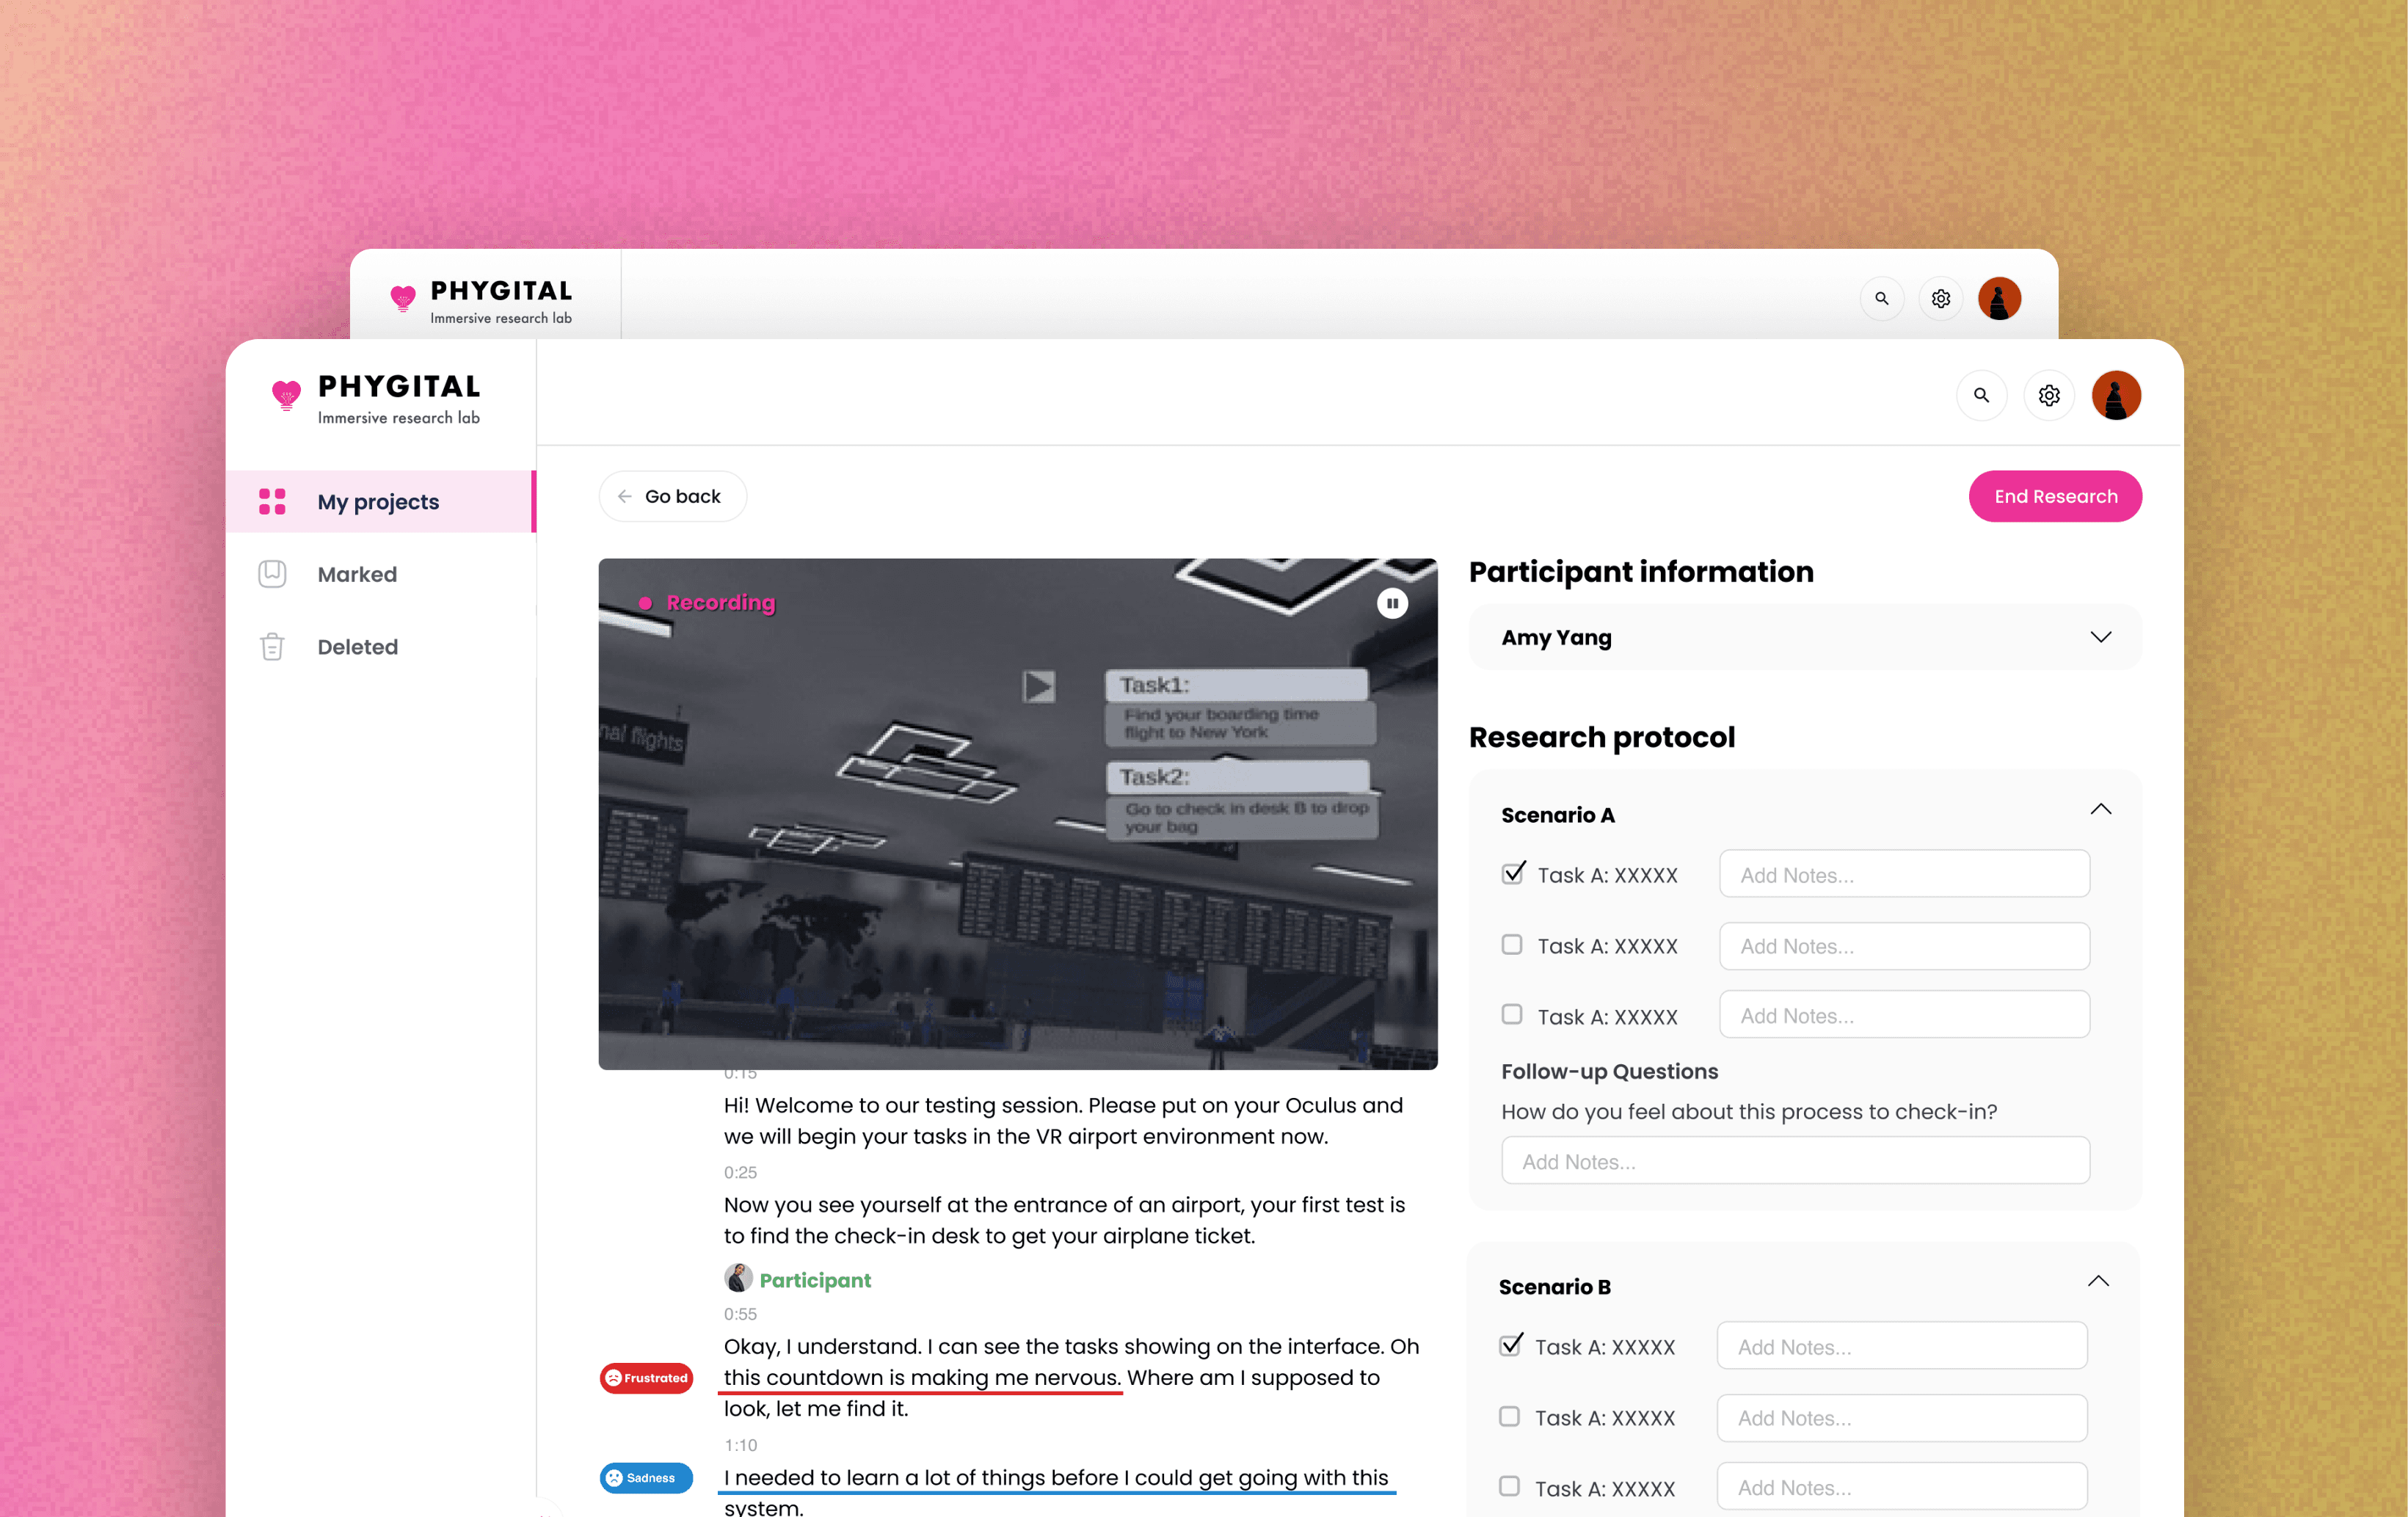
We developed an all-in-one research platform that provides real-time sentiment feedback for researchers to probe deeper when they see conflicting or interesting emotions at the moment. It serves as a layer of proof to complement real-time observations. After the research, a report will be automatically generated, including the highlighted video scripts, timestamps, transcription, notes, and emotional changes on a map.
Sentiment analysis
The participants' emotions were judged according to their language and tone changes, e.g., excited, frustrated, sad, satisfied, and sympathetic, and the researcher could make notes according to the key emotions.
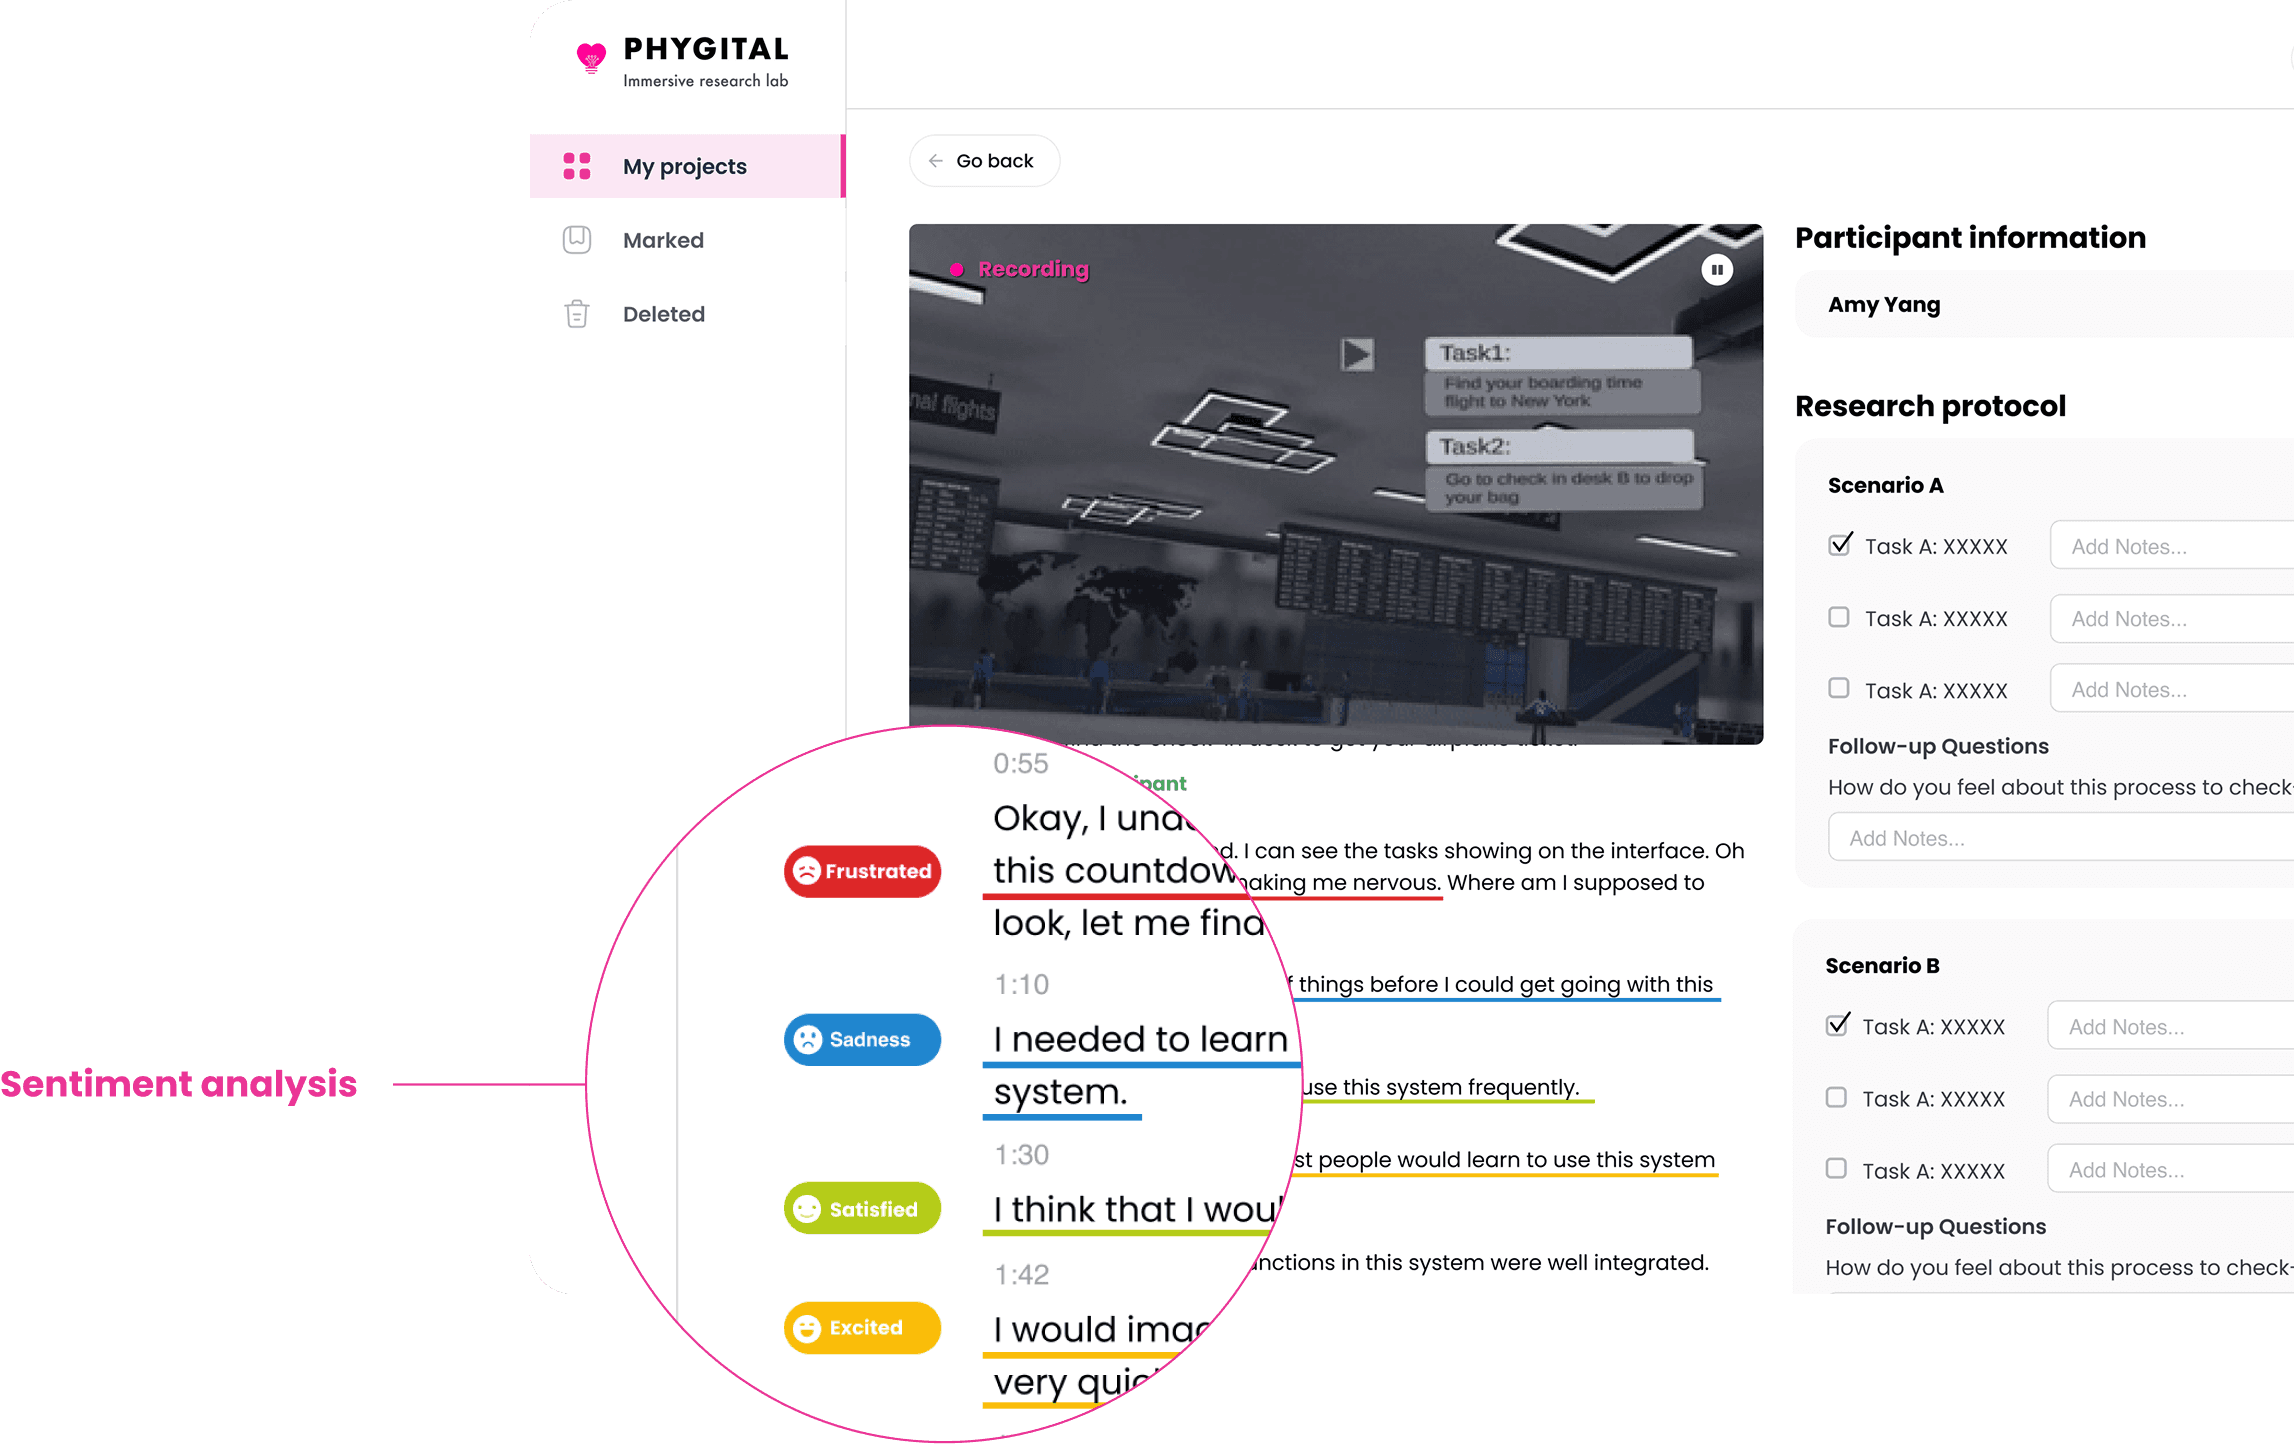
Real-time transcription
Transcribe participants' words in real-time, while researchers can take notes based on timestamps.

VR view
Provides researchers with a real-time VR view of participants, allowing for a comprehensive understanding of their experiences and behaviors during the study.

Analysis & Reporting
Provides researchers with a real-time VR view of participants, allowing for a comprehensive understanding of their experiences and behaviors during the study.
Impact & Reflections